Why most FIRE calculators use unrealistic return assumptions
Type "FIRE calculator" into any search engine and you'll get the same shape of tool a dozen times over: enter your current balance, your monthly contribution, and one expected return — usually somewhere between 7% and 10% — and it draws a single line to a single date. That date becomes the number people plan a decade of their life around.
The problem with one number
A single projected return implicitly assumes every year between now and your FIRE date behaves like the average. Markets don't work that way — a portfolio that returns 9% a year on average might do it through some combination of +25% years and -15% years, and which sequence you get, and when, changes your actual outcome substantially. A downturn early in accumulation costs you far less than the same downturn right before you'd planned to retire. A single-line calculator can't show you that risk because it was never modeling a range of futures — it was drawing one.
What we do instead
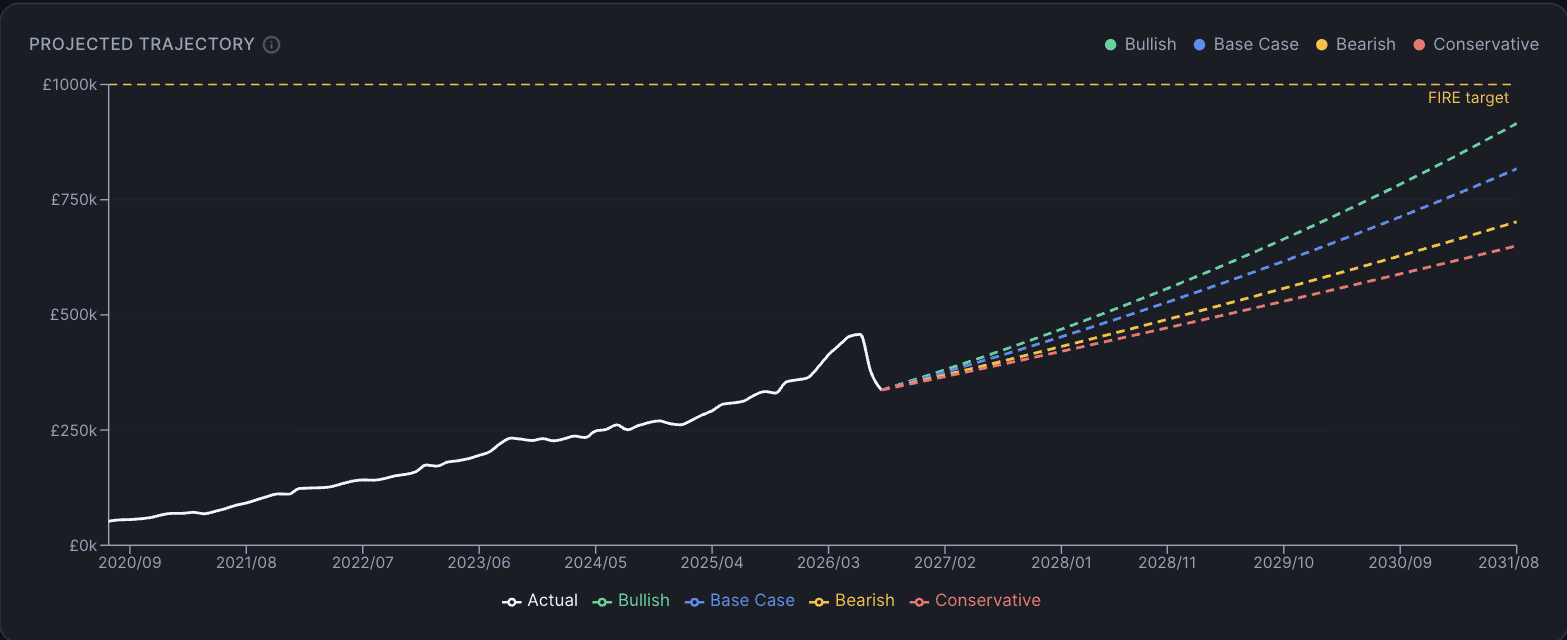
FirePath projects four scenarios in parallel, not one: Bullish (12%/yr), Base Case (9%/yr), Bearish (5%/yr), and Conservative (3%/yr). You see all four against your real current balance and real monthly contribution, so your FIRE date isn't a point — it's a range, and you can see how much your plan actually depends on the market cooperating.
On top of the four scenarios, FirePath also runs a Monte Carlo simulation seeded from your own portfolio's actual return history, rather than a generic market assumption — so the probability it shows you reflects how volatile your specific portfolio has actually been, not a textbook average.
Where those four numbers come from
Nominal annual rates, anchored to trailing 30-year benchmarks (roughly 1994–2024) rather than the full history of the market: Bullish tracks the S&P 500's 30-year trailing CAGR (~11–12%); Base Case tracks MSCI World's 30-year trailing nominal average (~8–9%); Bearish approximates a below-average stretch, similar to a 60/40 portfolio (~5%); Conservative approximates a cash-and-bonds blend over the same period (~3%). They're editable per account, not fixed — these are the defaults, not a guarantee.
Why this matters more than it sounds
We've had to correct our own default assumptions before after realizing they leaned too optimistic — which is exactly the trap a single-number calculator makes easy to fall into and hard to notice. A calculator that only ever shows you the outcome where things go well isn't lying to you outright, but it isn't showing you the plan, either — it's showing you the best case and calling it the plan.
See your own 4-scenario FIRE projection
Free forever, no credit card required — takes about two minutes to set up.
Start tracking for freeFirePath is not a financial adviser. This post is for informational purposes only. FAQ · Privacy