The simple way to
know your FIRE date.
Add your monthly balance. See your FIRE date. No spreadsheet, no advisor, no complexity — just a clear answer to whether you're on track.
No card required · Free tier forever
Your FIRE date
liveCoast FIRE at 321 365,76 $
You're saving every month. But are you actually on track?
Most people don't find out they're behind until their 50s — long after the small decisions that mattered. A spreadsheet only updates when you remember to open it. FirePath recalculates every month, from your real numbers, not a rough guess.
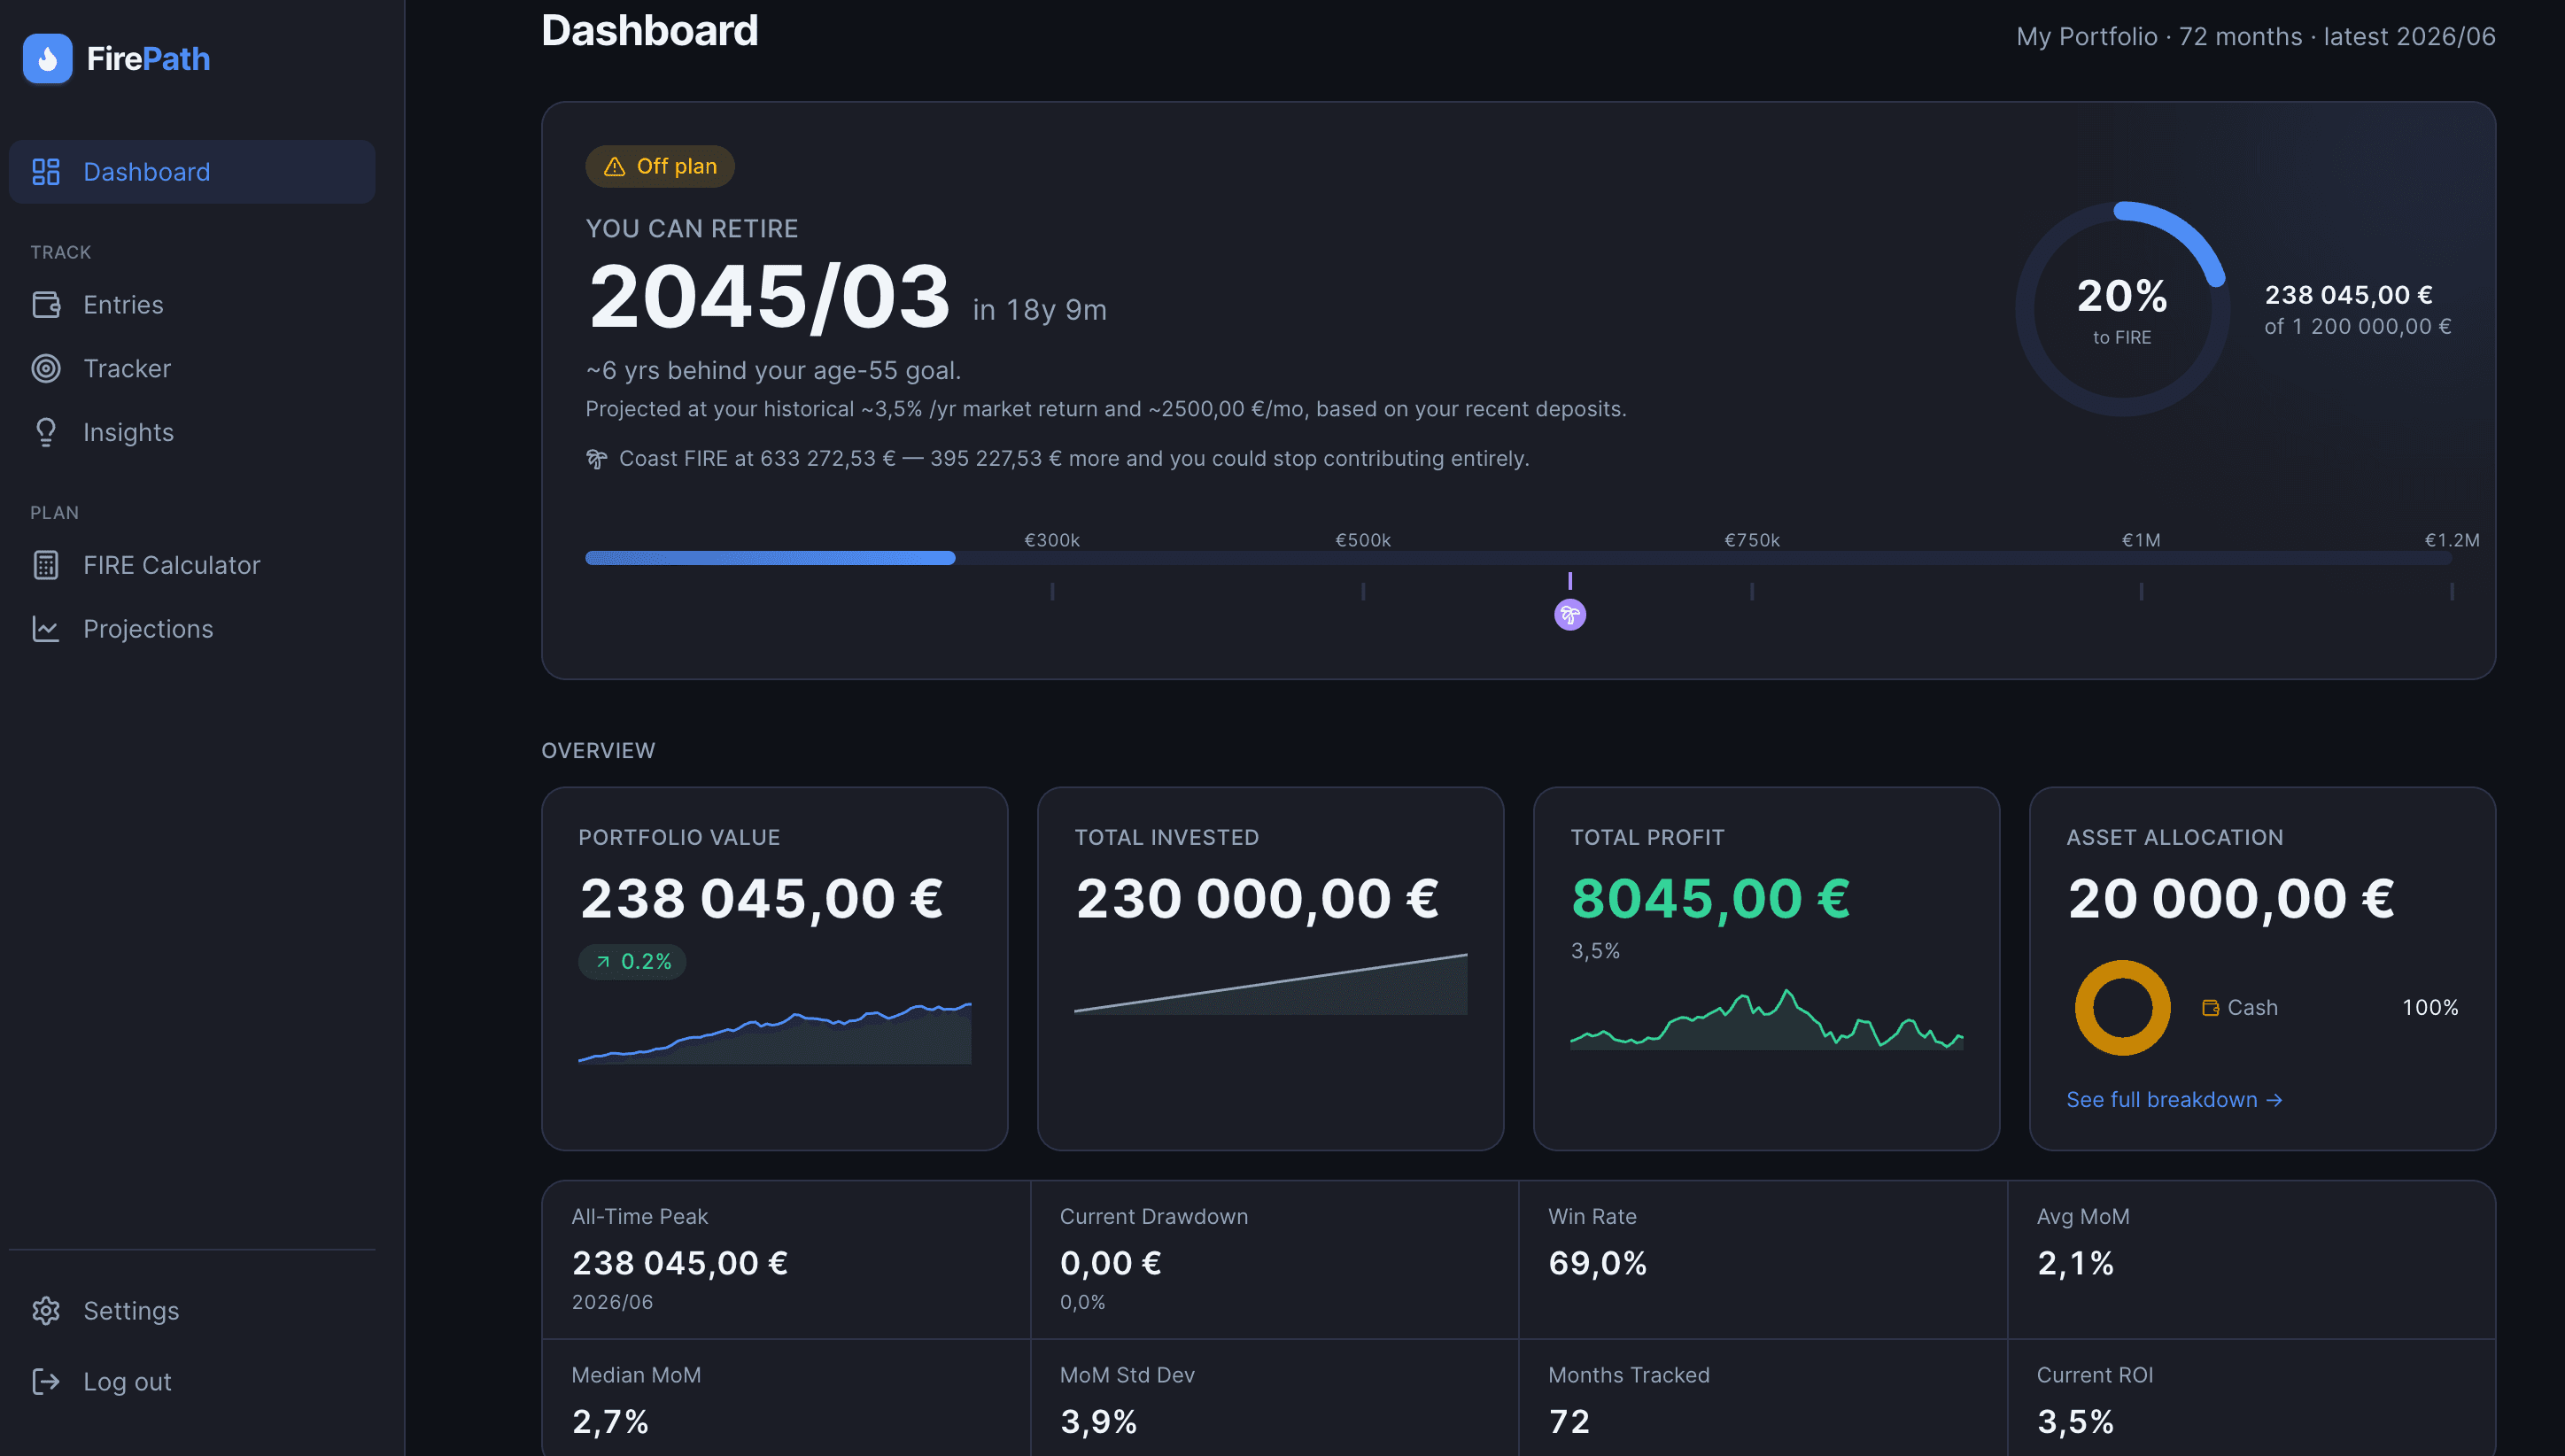
Your FIRE date, recalculated every month from real balances — including Coast FIRE.
One dashboard: value, drawdown, win rate, and allocation, no spreadsheet.
Real screenshot, real demo account — not a mockup.
Ahead of plan, or behind it?
Illustrative exampleThe solid white line is what actually happened. The four dashed lines are possible futures — Bullish, Base, Bearish, Conservative — so "ahead of plan" always means something concrete: tracking above the Base Case.
Set a target. See the drift.
Illustrative exampleSet a target mix by asset class (e.g. 70% stocks / 20% bonds / 10% cash). The moment your real holdings drift more than 5 points off that target, it's flagged below — Overweight or Underweight, not just a chart to interpret yourself.
Asset Allocation
Your actual breakdown against the target you set on the Entries page.
| Asset class | Actual | Target | Δ | Status |
|---|---|---|---|---|
| Stocks | 78% (35 100,00 $) | 70% | +8pp | Overweight |
| Bonds | 12% (5400,00 $) | 20% | -8pp | Underweight |
| Cash | 10% (4500,00 $) | 10% | +0pp | On target |
Already tracking elsewhere? Bring your history with you.
Illustrative exampleUpload an export and FirePath rebuilds your whole balance history from it — no typing in old months by hand. Major broker formats are recognized instantly, and AI-assisted import (Pro & Family) reads anything else too — any bank, any broker, no reformatting.
portfolio_export.csv
2.1 MB · uploaded
Two people, one shared FIRE number.
Illustrative exampleInvite a partner and get one combined household FIRE date instead of two separate spreadsheets — you each keep your own portfolio and login, nothing shared but the math. Add a kid profile too, with its own savings projection to whatever age you set.
238 045,00 $ · 2026/07
174 455,00 $ · 2026/07
Household FIRE date
2038/11
Target 1 100 000,00 $ at your ~9%/yr combined return and 3500,00 $/mo combined deposits
12 400,00 $ as of 2026/07 — projects to 48 900,00 $ by age 18
Everything in one dashboard
Not another spreadsheet. A focused tool that answers one question: are you on track?
Plan
4-scenario + Monte Carlo
Fixed-rate, 4-scenario, and Monte Carlo projections that update as you type — with a sensitivity heat-map.
Monte Carlo, done right
Box-Muller simulations from your own return history. See the odds, not just a single optimistic line.
Coast FIRE, built in
The exact balance where you could stop contributing today and still get there on schedule.
Track
Import your history, don't retype it
Major broker formats are recognized instantly. Pro and Family add AI-assisted import that reads any other bank or broker's file too — no format we can't handle.
Balance tracks itself (Pro)
Add your holdings once — Pro re-prices them every night and keeps your Tracker current. No more remembering to log in and type a number.
Actual vs. plan, monthly
A rolling comparison against all four scenarios, a streak counter, and a drift trend line — is the gap closing or widening?
What's really driving your growth
We split your monthly change into deposits vs market performance, so you know if you're actually ahead — or just saving a lot.
Annotate your journey
Tag entries with life events — bought a car, got a bonus — and see them marked right on your growth chart.
Allocate
Target allocation, drift, and status
Set a target mix by asset class, and get flagged the moment you drift too far — Overweight or Underweight, not just a chart to interpret yourself.
Real multi-currency conversion
Hold tickers or cash in any currency — converted into your portfolio's currency at the live rate, not just relabeled.
One dashboard, the full picture
Portfolio value, FIRE progress, drawdown, win rate, and volatility — no spreadsheet required.
Retire
Retirement drawdown
Model the spending phase: SWR, dynamic %, or guardrails — with longevity risk built in.
Family
One household dashboard
Invite a partner and get combined net worth and one shared FIRE date — you each keep your own portfolio and login. Family plan.
Kids' Futures
A savings projection for each kid, tracked toward whatever target age you set, separate from your own FIRE number — Family plan.
Simple pricing
Free
For anyone getting serious about FIRE
- Your real FIRE date — 4 scenarios + Coast FIRE
- Ahead or behind plan? Tracked monthly
- Full dashboard — drawdown, win rate & more
- 500-run Monte Carlo odds
Pro
PopularFor people done manually updating spreadsheets
billed monthly
Everything in Free, plus:
- Balances update themselves, nightly
- Your whole journey, not just 12 months
- Drift alerts — before it costs you
- Retirement modeling: SWR, dynamic %, guardrails
Family
HouseholdFor two people, one shared FIRE plan
billed monthly
Everything in Pro, plus:
- One dashboard for both of you
- Partner invite — combined net worth
- A savings plan for each kid
- One household FIRE number
Stop guessing. Start tracking.
Set up your tracker in two minutes and find out your real FIRE date today.
Start free →Not ready to sign up yet?
Drop your email and we'll let you know when new features ship — no spam, unsubscribe any time.